Question 2 (a)
Question 2 (c)
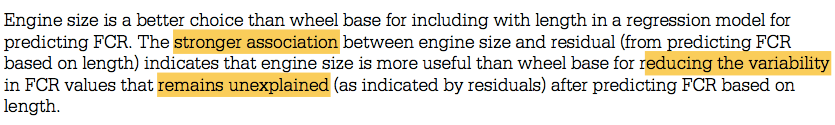
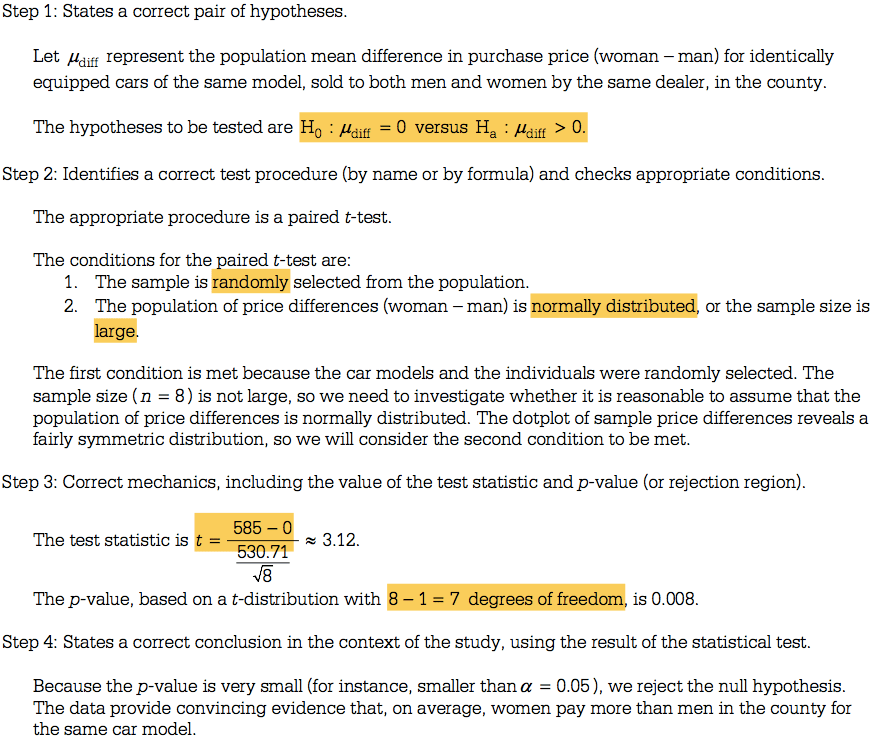
Question 3 (c)
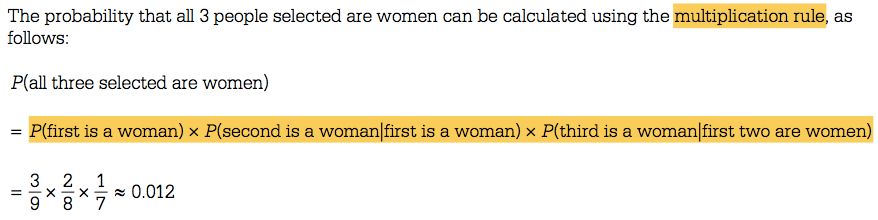
Question 4 (a)

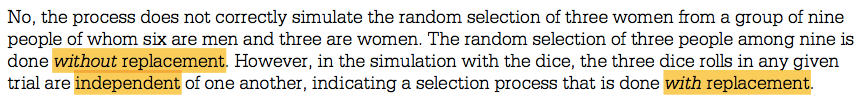
Question 5
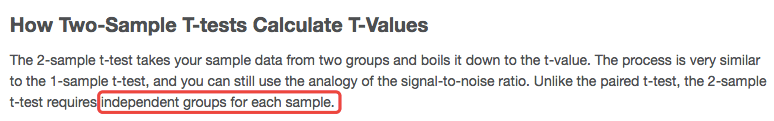
Assumption in 2 sample independence T-test
Normality: Assumes that the population distributions are normal. The t-test is quite robust over moderate violations of this assumption. It is especially robust if a two tailed test is used and if the sample sizes are not especially small. Check for normality by creating a histogram.
Independent Observations: The observations within each treatment condition must be independent.
Equal Variances: Assume that the population distributions have the same variance. This assumption is quite important (If it is violated, it makes the test’s averaging of the 2 variances meaningless).
If it is violated, then use a modification of the t-test procedures as needed.
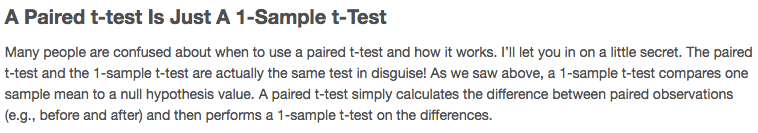
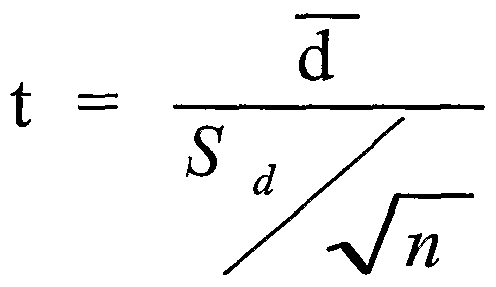
Paired Sample T test
- The matched-pair t-test (or paired t-test or paired samples t-test or dependent t-test) is used when the data from the two groups can be presented in pairs, For example where the same people are being measured in before-and-after comparison or when the group is given two different tests at different times (e.g. pleasantness of two different types of chocolate).
Assumptions in paired sample t-test
The first assumption in the paired sample t-test is that only the matched pair can be used to perform the paired sample t-test.
In the paired sample t-test, normal distributions are assumed.
Variance in paired sample t-test: in a paired sample t- test, it is assumed that the variance of two sample is same.
The data is measurement data-interval/ratio
Independence of observation in paired sample t-test: in a paired sample t-test, observations must be independent of each other.
Paired t-test vs two-sample t-test
Paired t- test
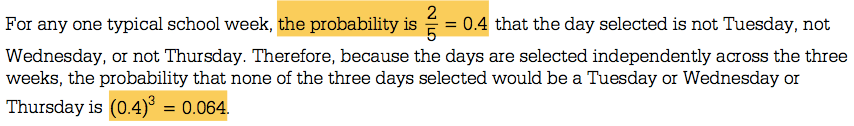
Question 6 (b)
Question 6 (c)
Question 6 (d)